ตำรายาของประเทศไทย
Thai Pharmacopoeia
สำนักยาและวัตถุเสพติด กรมวิทยาศาสตร์การแพทย์ กระทรวงสาธารณสุข
Bureau of Drug and Narcotic, Department of Medical Sciences, Ministry of Public Healthสำนักยาและวัตถุเสพติด กรมวิทยาศาสตร์การแพทย์ กระทรวงสาธารณสุข
Bureau of Drug and Narcotic, Department of Medical Sciences, Ministry of Public Health2.6 RAMAN SPECTROMETRY
Raman spectrometry (inelastic light scattering) is a light-scattering process in which the specimen under examination is irradiated with intense monochromatic light (usually laser light) and the light scattered from the specimen is analyzed for frequency shifts.
Raman spectrometry is complementary to infrared spectrometry in the sense that the two techniques both probe the molecular vibrations in a material. However, Raman and infrared spectrometry have different relative sensitivities for different functional groups. Raman spectrometry is particularly sensitive to nonpolar bonds (e.g., C−C single or multiple bonds) and less sensitive to polar bonds. Hence, water, which has a strong infrared absorption spectrum, is a weak Raman scatterer and is thus well suited as a solvent for Raman spectrometry.
Apparatus
Spectrometers for recording Raman spectra typically consist of the following components:
(1) a monochromatic light source, typically a laser, with a wavelength in the ultraviolet, visible or nearinfrared region;
(2) suitable optics (lens, mirrors or optical-fibre assembly) which directs the irradiating light to and collects the scattered light from the sample;
(3) an optical device (monochromator or filter) that transmits the frequency-shifted Raman scattering and prevents the intense incident frequency (Rayleigh scattering) from reaching the detector;
(4) a dispersing device (grating or prism monochromator) combined with wavelength-selecting slits and a detector (usually a photomultiplier tube); or a dispersing device (grating or prism) combined with a multichannel detector (usually a charge-coupled device, CCD); an interferometer with a detector that records the intensity of the scattered light over time, and a datahandling device that converts the data to the frequency or wavenumber domain by a Fourier-transform calculation.
Preparation of the Sample
Raman spectra can be obtained from solids, liquids and gases either directly, or in glass containers or tubes, generally without prior sample preparation or dilution.
A major limitation of Raman spectrometry is that impurities may cause fluorescence that interferes with the detection of the much weaker Raman signal. Fluorescence may be avoided by choosing a laser source with a longer wavelength, for example in the near infrared, as the exciting line. The intensity of certain Raman lines may be enhanced in a number of ways, for instance in Resonance Raman (RR) and by Surface Enhanced Raman Spectrometry (SERS). Due to the narrow focus of the irradiating laser beam, the spectrum is typically obtained from only a few microlitres of sample. Hence, the sample in homogeneities must be considered, unless the sample volume is increased, for example by rotation of the sample.
Identification and Quantitation Using Reference Substances
Prepare the substance to be examined and the reference substance by the same procedure and record the spectra under the same operational conditions. The maxima in the spectrum obtained with the substance to be examined correspond in position and relative intensity to those in the spectrum obtained with the reference substance (RS).
When the spectra recorded in the solid state show differences in the positions of the maxima, treat the substance to be examined and the reference substance in the same manner so that they crystallize or are produced in the same form, or proceed as described in the monograph, and then record the spectra.
While Beer-Lambert’s law is not valid for Raman spectrometry, Raman intensity is directly proportional to the concentration of the scattering species. As for other spectroscopic techniques, quantitation can be performed using known amounts or concentrations of reference substances. Owing to the small spatial resolution of the technique, care must be taken to ensure representative samples of standards and unknowns, for example by making sure that they are in the same physical state or by using an internal standard for liquid samples.
Identification and Quantitation Using Spectral Libraries and Statistical Methods for Classification and Calibration
CONTROL OF INSTRUMENT PERFORMANCE Use the apparatus according to the manufacturer’s instructions and carry out the prescribed calibrations and system performance tests at regular intervals, depending on the use of the apparatus and the substances to be examined. When using Raman spectrometry for quantitative determinations, or when setting up spectral reference libraries for (chemometric) classification or calibration, particular care should be taken to ensure that corrections are made or measures are taken to control the variability in wavenumber and response-intensity of the instrumentation.
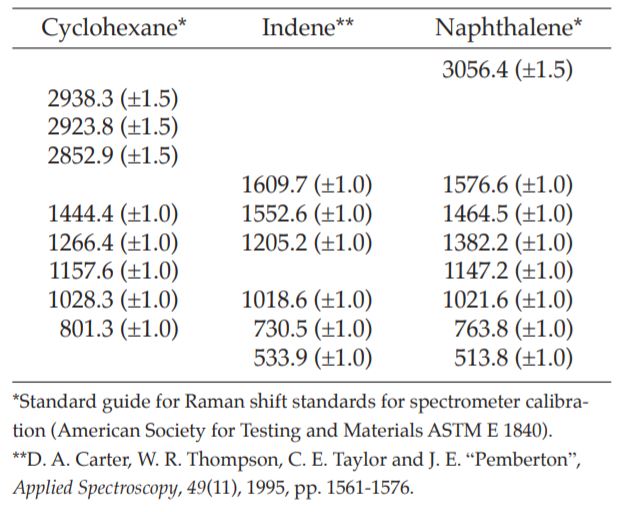
VERIFICATION OF THE WAVENUMBER SCALE Verify the wavenumber scale of the Raman shift (normally expressed in reciprocal centimetres) using a suitable standard which has characteristic maxima at the wavenumbers under investigation, for example, an organic substance, an Ne lamp or Ar+ plasma lines from an argon-ion laser. The calibration measurement should be matched to the sample type, i.e. a solid calibration sample should be used for solid samples and a liquid calibration sample for liquid samples. Choose a suitable substance (e.g., indene, cyclohexane or naphthalene) for which accurate wavenumber shifts have been established. The indene sample can favourably be placed in an NMR tube, evacuated and sealed under inert gas, and stored cool in the dark to avoid degradation of the sample.
Wavenumber, Shifts (and Acceptable Tolerances) of Cyclohexane, Indene and Naphthalene
VERIFICATION OF THE RESPONSE-INTENSITY SCALE The absolute and relative intensities of the Raman bands are affected by several factors including:
(1) the state of polarization of the irradiating light;
(2) the state of polarization of the collection optic;
(3) the intensity of the irradiating light;
(4) differences in instrument response;
(5) differences in focus and geometry at sample; (6) differences in packing density for solid samples.
Appropriate acceptance criteria will vary with the application but a day-to-day variation of 10 per cent in relative band intensities is achievable in most cases.
ESTABLISHMENT OF A SPECTRAL REFERENCE LIBRARY
Record the spectra of a suitable number of materials which have been fully tested (e.g., as prescribed in a monograph) and which exhibit the variation (manufacturer, batch, crystal modification, particle size, etc.) typical of the material to be analyzed. The set of spectra represents the information that defines the similarity border or quantitative limits, which may be used, e.g. to identify the substance or control the amount formed in a manufacturing process. The number of substances in the database depends on the specific application. The collection of spectra in the database may be represented in different ways defined by the mathematical technique used for classification or quantitation.
The selectivity of the database which makes it possible to identify positively a given material and distinguish it adequately from other materials in the database is to be established during the validation procedure. This selectivity must be challenged on a regular basis to ensure ongoing validity of the database; this is especially necessary after any major change in a substance (e.g., change in a supplier or in the manufacturing process of the material) or in the set-up of the Raman instrument (e.g., verification of the wavenumber and response repeatability of the spectrometer).
This database is then valid for use only with the originating instrument, or with a similar instrument, provided the transferred database has been demonstrated to remain valid.
METHOD Prepare and examine the sample in the same manner as for the establishment of the database. A suitable mathematical transformation of the Raman spectrum may be calculated to facilitate spectrum comparison or quantitative prediction.
Comparison of the spectra or transforms of the spectra or quantitative prediction of properties or amounts in the material in question may involve the use of a suitable chemometric or statistical classification or calibration technique.