ตำรายาของประเทศไทย
Thai Pharmacopoeia
สำนักยาและวัตถุเสพติด กรมวิทยาศาสตร์การแพทย์ กระทรวงสาธารณสุข
Bureau of Drug and Narcotic, Department of Medical Sciences, Ministry of Public Healthสำนักยาและวัตถุเสพติด กรมวิทยาศาสตร์การแพทย์ กระทรวงสาธารณสุข
Bureau of Drug and Narcotic, Department of Medical Sciences, Ministry of Public Healthตำรายาของประเทศไทยที่จัดทำขึ้น เพื่อเป็นมาตรฐานในการตัดสิน
คุณภาพยา ที่ผลิตและจำหน่ายในท้องตลาด "The Thai Pharmacopoeia (TP) has been established since 1987 to set forth the quality standards for modern drugs and their preparations marketed in Thailand"
ตำรายาของประเทศไทย (Thai Pharmacopoeia, TP) เป็นตำรายาที่ได้มีการดำเนินการและจัดพิมพ์เล่มแรกในปี ค.ศ. 1987 ฉบับปัจจุบันปี ค.ศ. 2011, ฉบับเพิ่มเติมปี ค.ศ. 2020 และฉบับเพิ่มเติมปี ค.ศ. 2024 โดยสำนักยาและวัตถุเสพติด กรมวิทยาศาสตร์การแพทย์ TP เป็นตำรายาที่รวบรวมข้อกำหนดมาตรฐานทางเคมี-ฟิสิกส์และข้อมูลอื่นๆ เช่น ด้านความปลอดภัยและการใช้ยา สำหรับการควบคุมคุณภาพมาตรฐานยาแผนปัจจุบัน แต่ละชนิดรวมถึงผลิตภัณฑ์ที่มีจำหน่ายในประเทศไทย อีกทั้งเป็นตำรายาของประเทศไทย ที่กระทรวงสาธารณสุขประกาศรับรองในราชกิจจานุเบกษา
The Thai Pharmacopoeia (TP) was first established in 1987 by the Bureau of Drug and Narcotic, Department of Medical Sciences to set forth the quality standards for modern drugs and their preparations marketed in Thailand, ensuring their identity, safety and efficacy. The current publications are TP II Volume I, Part I (2011), TP II Volume I Part 1 Supplement 2020 and TP II Volume I Part 1 Supplement 2024. Additionally, the Ministry of Public Health has designated the publications as official compendia.

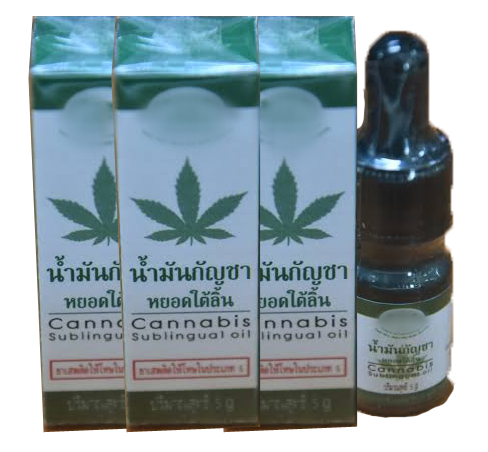
Cannabis Sublingual Drops are the Cannabis Extract in a suitable vegetable oil such as sesame oil, olive oil or coconut oil. They contain not less than 90.0 per cent and not more than 110.0 per cent of the labelled amounts of tetrahydrocannabinol or canna
Cannabis Sublingual Drops are the Cannabis Extract in a suitable vegetable oil such as sesame oil, olive oil or coconut oil. They contain not less than 90.0 per cent and not more than 110.0 per cent of the labelled amounts of tetrahydrocannabinol or canna
Cannabis Sublingual Drops are the Cannabis Extract in a suitable vegetable oil such as sesame oil, olive oil or coconut oil. They contain not less than 90.0 per cent and not more than 110.0 per cent of the labelled amounts of tetrahydrocannabinol or canna
Cannabis Sublingual Drops are the Cannabis Extract in a suitable vegetable oil such as sesame oil, olive oil or coconut oil. They contain not less than 90.0 per cent and not more than 110.0 per cent of the labelled amounts of tetrahydrocannabinol or canna
Cannabis Sublingual Drops are the Cannabis Extract in a suitable vegetable oil such as sesame oil, olive oil or coconut oil. They contain not less than 90.0 per cent and not more than 110.0 per cent of the labelled amounts of tetrahydrocannabinol or canna
สำนักยาและวัตถุเสพติด กรมวิทยาศาสตร์การแพทย์
กระทรวงสาธารณสุข (อาคาร 2 และอาคาร 4) 88/7
ซอยบำราศนราดูร ถนนติวานนท์ ตำบลตลาดขวัญ
อำเภอเมือง จังหวัดนนทบุรี 11000
02 951 0000 ต่อ 99120 (อาคาร 2 ด้านยา)